First Quarter 2023 Market Review
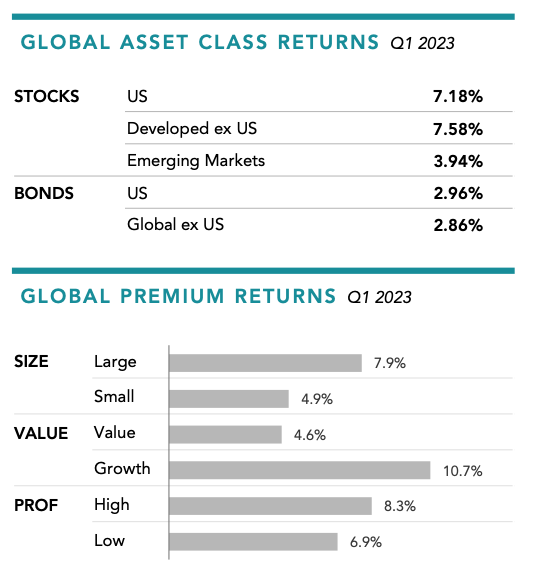
Global stocks gained nearly 7% in the first quarter, continuing their upward momentum that began in the fourth quarter of last year. Market volatility was relatively muted until March, when concerns about the stability of the banking sector made headlines. Following last year when value stocks beat growth by 20%, the first quarter saw value stocks lag growth by 12%.1
Information technology names led for the quarter, lifting the returns of large growth stocks. Less profitable growth stocks especially outperformed, with stocks like Nvidia that returned 90%.
Energy stocks, many of which were still within the value side of the market despite a strong run-up last year, dropped by 3.0%. Financials, after being hit hard in March, ended the quarter down 1.8%.
Small cap stocks generally underperformed, especially in the US, but not universally. While within large cap stocks, those with lower profitability outperformed, the reverse was true in small caps, where higher profitability stocks generally outperformed.
Click Here for Quarterly Summary

1. As measured by the return of the MSCI All Country World Value IMI Index (net div.) minus the return of the MSCI All Country World Growth IMI Index (net div).
Past performance is no guarantee of future results. This information is provided for registered investment advisors and institutional investors and is not intended for public use. Dimensional Fund Advisors LP is an investment advisor registered with the Securities and Exchange Commission.
Market segment (index representation) as follows: US Stock Market (Russell 3000 Index), Developed ex US Stocks (MSCI World ex USA IMI Index [net div.]), Emerging Markets (MSCI Emerging Markets IMI Index [net div.]), US Bond Market (Bloomberg US Aggregate Bond Index), and Global Bond Market ex US (Bloomberg Global Aggregate ex-USD Bond Index [hedged to USD]), Global Stock Market (MSCI All Country World IMI Index [net div.]). Sector returns are derived by Dimensional using constituent data from the MSCI All Country World IMI Index. Returns for specific securities are sourced from the MSCI All Country World IMI Index using daily security returns. Securities without a GICS sector are excluded. Sectors are classified according to GICS Industry code. GICS was developed by and is the exclusive property of MSCI and S&P Dow Jones Indices LLC, a division of S&P Global.S&P data © 2023 S&P Dow Jones Indices LLC, a division of S&P Global. All rights reserved. Frank Russell Company is the source and owner of the trademarks, service marks, and copyrights related to the Russell Indexes. MSCI data © MSCI 2023, all rights reserved. Bloomberg data provided by Bloomberg. Indices are not available for direct investment. Index performance does not reflect the expenses associated with the management of an actual portfolio. References to specific company securities should not be construed as a recommendation or investment advice. Global Premium Returns are computed from MSCI All Country World IMI Index published security weights and Dimensional computed security returns and Dimensional classification of securities based on size, value, and profitability parameters. Within the US, Large Cap is defined as approximately the largest 90% of market capitalization in each country or region; Small Cap is approximately the smallest 10%. Within the non-US developed markets, Large Cap is defined as approximately the largest 87.5% of market capitalization in each country or region; Small Cap is approximately the smallest 12.5%. Within emerging markets, Large Cap is defined as approximately the largest 85% of market capitalization in each country or region; Small Cap is approximately the smallest 15%. Designations between value and growth are based on price-to-book ratios. Value is defined as the 50% of market cap with the lowest price-to-book ratios by size category and growth is the highest 50%. Profitability is measured as operating income before depreciation and amortization minus interest expense scaled by book. High profitability is defined as the 50% of market cap with the highest profitability by size category and low profitability is the lowest 50%. REITs and utilities, identified by GICS code, and stocks without size, relative price, or profitability metrics are excluded from this analysis. Countries not in the Dimensional investable universe are excluded from the analysis. Their performance does not reflect the expenses associated with the management of an actual portfolio. This information is intended for educational purposes and should not be considered a recommendation to buy or sell a particular security. Named securities may be held in accounts managed by Dimensional.