Midyear Review: From Spring Slump to Summer Surge
KEY TAKEAWAYS
- The S&P 500 hit record levels in early June, driven by chipmakers and other tech stocks.
- Equity returns in developed international markets were in line with those in the US, but emerging markets fared the best.
- The US Federal Reserve, now under new leadership, continued holding interest rates steady amid an uptick in inflation.
- Click Here for Quarterly Summary
The US market struck fresh highs near the year’s midway point, rallying after taking a downward turn in March as investors weighed the impact of the war in Iran, among other factors. Driven by chipmakers and other technology stocks, the S&P 500 Index hit record levels in late May and early June followed by up-and-down trading near the end of the month.1 Equity returns in developed international markets were in line with those in the US, but emerging markets fared better than both. The US Federal Reserve, now under new leadership, continued holding interest rates steady amid an uptick in inflation. In the bond market, US Treasury prices fell as the benchmark 10-year yield rose to nearly 4.5%, close to its highest level in more than a year.2
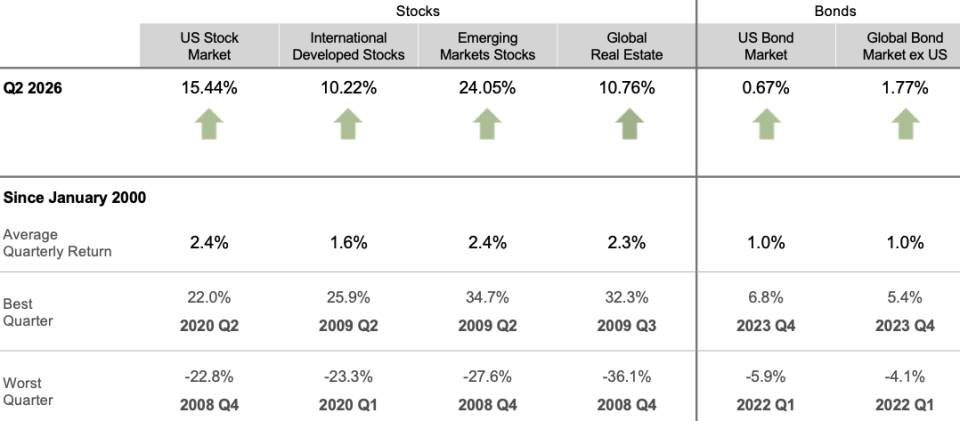
The S&P 500 rose 10% and the tech-heavy Nasdaq added 14% as of June 19. Technology companies rebounded from an earlier decline by software stocks, as AI enthusiasm continued to boost chipmakers and others benefiting from spending on artificial intelligence. Shares of SpaceX made their debut in June in what was the largest IPO on record; it was among a handful of expected offerings from large technology firms this year, including several AI-related companies.3
Oil prices surged after the US and Israel struck Iran in late February, with hostilities continuing in the following months. A new ceasefire agreement was reached in mid-June.4 For investors, it is worth remembering that global equity returns have not been highly correlated with the level of oil prices. While the cost of oil may have some impact on stocks, it is just one of many factors to consider when looking at overall market performance. Furthermore, the US economy may be less impacted by oil shocks now than at some times in the past, as the economy has become more services-oriented and oil sources are more diversified.
Global equities, as measured by the MSCI All Country World Index (net dividends), rose 12% as of June 19. Stocks in developed international markets outside the US added 10%, as measured by the MSCI World ex USA Index (net dividends). The MSCI Emerging Markets Index (net dividends) fared much better, gaining 29%.5 Global equity markets have remained near record highs despite geopolitical conflict. This outcome is not surprising given how markets have fared in previous events. Looking at 21 of these over 36 years, returns were slightly negative for the first five days, but then turned positive over subsequent horizons. This would seem consistent with the market resetting prices in light of negative news at the start.
Likewise, results in 2026 haven’t helped support the common belief that precious metals such as gold hedge adverse conditions in the world. Since the onset of the war in Iran on February 28, an investment in gold has fallen by nearly 20%, erasing much of its strong gains from earlier in the year (see Exhibit 1). By comparison, the S&P 500 Index is up almost 10% over that same time period.
Exhibit 1: All That Glitters Gold vs. S&P 500, total returns for 2026 as of June 19
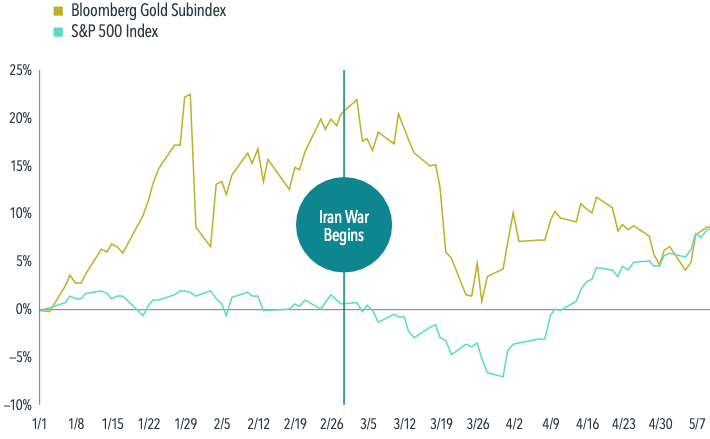
This reinforces the importance of evaluating the role assets play in a portfolio. Stocks offer something in exchange for their risk: a positive expected return. In contrast, it’s challenging to support positive expected returns simply for holding gold. Note, too, that the precious metal has had negative years more frequently than the US stock market.
Inflation Persists
At its most recent meeting in June, the US Federal Reserve held the federal-funds target rate steady at 3.5% to 3.75%.6 It was the first meeting under new Fed Chairman Kevin Warsh. The decision came amid an increase in headline inflation, which rose to its highest level since 2023. Productivity growth, strong capital investment, and job gains also influenced the decision. Core inflation, which excludes more-volatile food and energy items, remained relatively steady in May, rising 2.9% from a year ago.7
Market expectations for a rate cut this year have been reduced, especially since the start of the war in Iran. According to CME Group’s FedWatch tool, the probability the fed-funds rate would be lower than the prevailing rate after the Fed’s December meeting was 96% in late February; the odds now favor a rate increase before the end of the year. This swing seems attributable to inflation concerns partly driven by rising oil prices stemming from the conflict in the Middle East.
In the bond market, US Treasuries fell 0.3%, sending the yield on the benchmark 10-year Treasury up to 4.46% as of June 19.8 The broader bond market was slightly higher, with the Bloomberg US Aggregate Bond Index up 0.02% and the Bloomberg Global Aggregate Bond Index (hedged to USD), a broad benchmark of sovereign and corporate debt, rising 0.7% as of June 19.9
Foot Notes:
- S&P data © 2026 S&P Dow Jones Indices LLC, a division of S&P Global. All rights reserved. Data as of March 20. Indices are not available for direct investment. Their performance does not reflect the expenses associated with the management of an actual portfolio; Connor Smith, “Stocks Are Rising. S&P 500 Heads Back Toward Record High.” Barron’s, February 12, 2026.
- Returns are based on the Bloomberg US Treasury Bond Index as of March 20. Bloomberg data is provided by Bloomberg Finance LP. Source for US Treasuries: US Department of the Treasury.
- Jack Pitcher and Xavier Martinez, “The $1.6 Trillion Meltdown That Swept Through Software Stocks,” The Wall Street Journal, February 26, 2026.
- James Romoser and Gavin Bade, “Supreme Court Strikes Down Trump’s Global Tariffs,” The Wall Street Journal, February 20, 2026.
- Steve Kopack, “Oil Hits $100 per Barrel for First Time Since July 2022,” NBC News, March 8, 2026.
- MSCI data © MSCI 2026, all rights reserved. Data as of March 20. Indices are not available for direct investment. Their performance does not reflect the expenses associated with the management of an actual portfolio.
- The federal-funds rate is the overnight interest rate at which one depository institution (like a bank) lends to another institution some of its funds that are held at the Federal Reserve. Source: “Federal Reserve Issues FOMC Statement,” Federal Reserve, March 18, 2026.
- Inflation data is as defined by the consumer price index from the US Bureau of Labor Statistics; the core CPI is an aggregate of prices paid by urban consumers for a typical basket of goods, excluding food and energy; Megan Leonhardt, “Core Inflation Holds Steady,” Barron’s, March 11, 2026.
- “Daily Treasury Par Yield Curve Rates,” US Department of the Treasury. Data as of March 20.
Past performance, including hypothetical performance, is no guarantee of future results.
Diversification neither assures a profit nor guarantees against loss in a declining market.
The information in this material is intended for the recipient’s background information and use only. It is provided in good faith and without any warranty or representation as to accuracy or completeness. Information and opinions presented in this material have been obtained or derived from sources believed by Dimensional to be reliable, and Dimensional has reasonable grounds to believe that all factual information herein is true as at the date of this material. It does not constitute investment advice, a recommendation, or an offer of any services or products for sale and is not intended to provide a sufficient basis on which to make an investment decision. Before acting on any information in this document, you should consider whether it is appropriate for your particular circumstances and, if appropriate, seek professional advice. It is the responsibility of any persons wishing to make a purchase to inform themselves of and observe all applicable laws and regulations. Unauthorized reproduction or transmission of this material is strictly prohibited. Dimensional accepts no responsibility for loss arising from the use of the information contained herein.