Taking a Balanced View of the 60/40 Portfolio
With both fixed income and equities declining on the year, the traditional 60% stock/40% bond portfolio had a hard time offering much support in either asset category, leading some to question the utility of this approach. Although 2022 was the worst year in history for many bond indices, the performance of the 60/40 portfolio1 didn’t crack the top five peak-to-trough drawdowns in close to a century’s worth of data. The drawdown that reached 19% at its nadir was painful, but it’s only two-thirds of the 30% peak-to-trough drawdown investors2 endured through a particularly difficult period from 2007–2009. And the portfolio saw some recovery late in the year, ending down 14% for 2022.
During rocky markets, it is especially important for investors to focus not solely on where returns have been but also on where they could be going. Looking at the performance of a 60/40 portfolio following a decline of 10% or more since 1926, returns on average have been strong in the subsequent one-, three-, and five-year periods (see Exhibit 1).
Exhibit 1: A Case for Optimism: Performance of a 60/40 portfolio (60% S&P 500 Index/40% 5-year US Treasury notes) following a decline of 10% or more: January 1926—December 2022
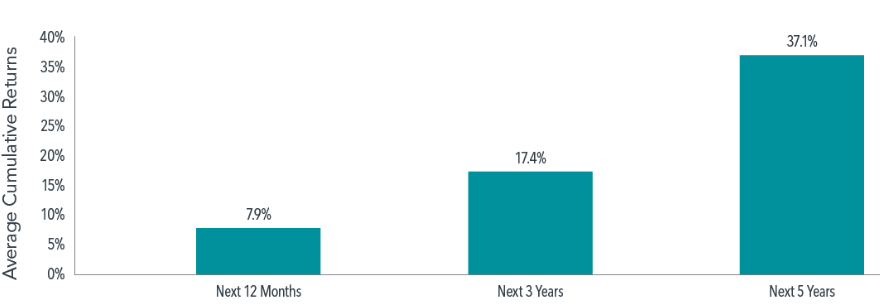
Past performance is not a guarantee of future results.
In USD. Drawdowns include all periods where the 60/40 portfolio declined by 10% or more from the prior peak. Peaks are defined as months where the 60/40 portfolio’s cumulative return exceeds all prior monthly observations. Returns are calculated for the one-, three-, and five-year look-ahead periods beginning the month after the 10% decline threshold is exceeded. The bar chart shows the average cumulative returns for the one-, three-, and five-year periods post-decline. There are 10, nine, and nine observations for the one-, three-, and five-year look-ahead periods, respectively. Source: Morningstar Direct as of December 31, 2022. Five-year US Treasury notes data provided by Morningstar. S&P data © 2023 S&P Dow Jones Indices LLC, a division of S&P Global. All rights reserved. Indices are not available for direct investment; therefore, their performance does not reflect the expenses associated with the management of an actual portfolio.
Silver Linings for Battered Bonds
Some may view fixed income as a safe haven for investors, expecting bonds to rise in value when stocks fall. However, this was not the case in 2022. The tandem decline for equities and fixed income was relatively rare. Benchmark US Treasuries posted their worst annual returns in decades, with 10-year Treasury notes losing 16.3%,3 a second straight annual loss. The last time investors saw back-to-back losses was in the late 1950s. The yield curve, which charts the difference in yield between long-dated and short-dated bonds, was inverted at year’s end. The 10-year yield ended just below 3.9%, while the 2- year yield was just above 4.4%,4 reflecting the higher short-term rates.
Higher interest rates can bring short-term pain as bond prices fall, but they can be beneficial in the long term and present new opportunities for fixed income investors. Some investors may be hesitant to take advantage of higher yields, perhaps because of concerns about the potential for even higher yields to come. They may even consider reducing their bond exposure. But if yields keep rising, investors seeking higher expected returns may still be better off maintaining the duration of their fixed income allocation. Rising yields affect fixed income portfolios in several ways. Longer-duration portfolios may experience larger immediate declines in value relative to shorter-duration portfolios as yields increase. But higher yields may lead to higher expected returns. Similarly, investors who have seen equity prices fall may be tempted to sell. But lower stock prices can be indicative of higher expected returns.5
Footnotes:
- The 60/40 portfolio consists of the S&P 500 Index (60%) and five-year US Treasury notes (40%). Five-year US Treasury notes data provided by Morningstar. S&P data © 2023 S&P Dow Jones Indices LLC, a division of S&P Global. All rights reserved.
- Peak-to-trough drawdowns include all periods where the 60/40 portfolio declined by 10% or more from the prior peak. Peaks are defined as months where the 60/40 portfolio’s cumulative return exceeds all prior monthly observations. Troughs are defined as the months where the 60/40 portfolio’s cumulative return losses from the prior peak are the largest.
- 10-year Treasury notes represented by Bloomberg US Treasury 10-Year Bond Index. Data provided by Bloomberg.
- Source: US Treasury.
- Eugene F. Fama and Kenneth R. French, “The Cross-Section of Expected Stock Returns,” Journal of Finance 47 (1992): 427–65.
The information in this material is intended for the recipient’s background information and use only. It is provided in good faith and without any warranty or representation as to accuracy or completeness. Information and opinions presented in this material have been obtained or derived from sources believed by Dimensional to be reliable, and Dimensional has reasonable grounds to believe that all factual information herein is true as at the date of this material. It does not constitute investment advice, a recommendation, or an offer of any services or products for sale and is not intended to provide a sufficient basis on which to make an investment decision. Before acting on any information in this document, you should consider whether it is appropriate for your particular circumstances and, if appropriate, seek professional advice. It is the responsibility of any persons wishing to make a purchase to inform themselves of and observe all applicable laws and regulations. Unauthorized reproduction or transmission of this material is strictly prohibited. Dimensional accepts no responsibility for loss arising from the use of the information contained herein.
This material is not directed at any person in any jurisdiction where the availability of this material is prohibited or would subject Dimensional or its products or services to any registration, licensing, or other such legal requirements within the jurisdiction.
“Dimensional” refers to the Dimensional separate but affiliated entities generally, rather than to one particular entity. These entities are Dimensional Fund Advisors LP, Dimensional Fund Advisors Ltd., Dimensional Ireland Limited, DFA Australia Limited, Dimensional Fund Advisors Canada ULC, Dimensional Fund Advisors Pte. Ltd., Dimensional Japan Ltd. and Dimensional Hong Kong Limited. Dimensional Hong Kong Limited is licensed by the Securities and Futures Commission to conduct Type 1 (dealing in securities) regulated activities only and does not provide asset management services.
Risks
Investments involve risks. The investment return and principal value of an investment may fluctuate so that an investor’s shares, when redeemed, may be worth more or less than their original value. Past performance is not a guarantee of future results. There is no guarantee strategies will be successful.